


KEY HIGHLIGHTS OF MASTERING DATA VISUALIZATIONS WITH POWER BI PROGRAM
1) Weekly sessions with industry professionals
2) Dedicated Learning Management Team
3) 100 hours of hands-on learning experience
4) Over 30 hours live sessions spread across 02 months
5) 45 hours of self-paced Learning
6) Learn from Industry Experts.
🔺More than 20+ industry-related projects and case studies
🔺24*7 Support
🔺1:1 Mock Interview
🔺Designed for both working professionals and fresh graduates
🔺Competitive Edge and Innovation
🔺 One-on-One with Industry Mentors
🔺Dedicated Learning Management Team
🔺No-Cost EMI Option
🔺High Demand and Career Opportunities
🔺Problem-Solving and Critical Thinking
WHY JOIN MASTERING IN DATA VISUALIZATION WITH TABLEAU PROGRAM?

Mastering Data Visualizations with Power BI OVERVIEW
This program focuses on essential tools for data management and visualization. It covers all the basics of querying and data manipulation on a relational database with a standard language from there, to graduate up into becoming very proficient utilizing one top platform for creating interactive & dynamic dashboards. This track teaches hands-on experience to develop skills in not just managing data but visualizing it properly. With extensive modules, you’ll learn how to solve advanced data problems and share findings more effectively.
ENROLL NOW, BOOK YOUR SEAT & AVAIL UPTO 30% FEE WAIVER
Mastering in Data Visualization with PowerBI Objectives
This program focuses mainly on creating strong data handling and visualization skills. Learn to query and manage relational databases with standard SQL, you will also build effective visualizations in leading visualization software. By the end of it you will know exactly how to work with raw data and transform it into useful information that can be presented in a clear, engaging way. When you can address the assignments, communicate data-driven insights and facilitate informed decision-making, this accomplished training is achieved.
Why Learn Mastering in Data Visualization with PowerBI ?

HANDS-ON EXPERIENCE
This course equips you with the expertise to pursue roles such as Data Analyst, Data Scientist, Business Intelligence Analyst, and more, with potential for career advancement Benefit from practical, hands-on training that prepares you to apply your skills in real-world scenarios and complex data tasks.
Program Advantages
✅ Provides a cohesive understanding of data management, analytics, and visualization from extraction to presentation, ensuring a well-rounded skill set.
✅ Includes real-world projects and case studies that allow you to apply theoretical knowledge to practical situations, enhancing problem-solving skills and real-world readiness.
✅ Focuses on contemporary and industry-leading tools like SQL, and Tableau keeping you up-to-date with current technologies and methodologies.
✅ Features a curriculum that is regularly updated to reflect the latest industry trends, tools, and best practices, ensuring your skills remain relevant.
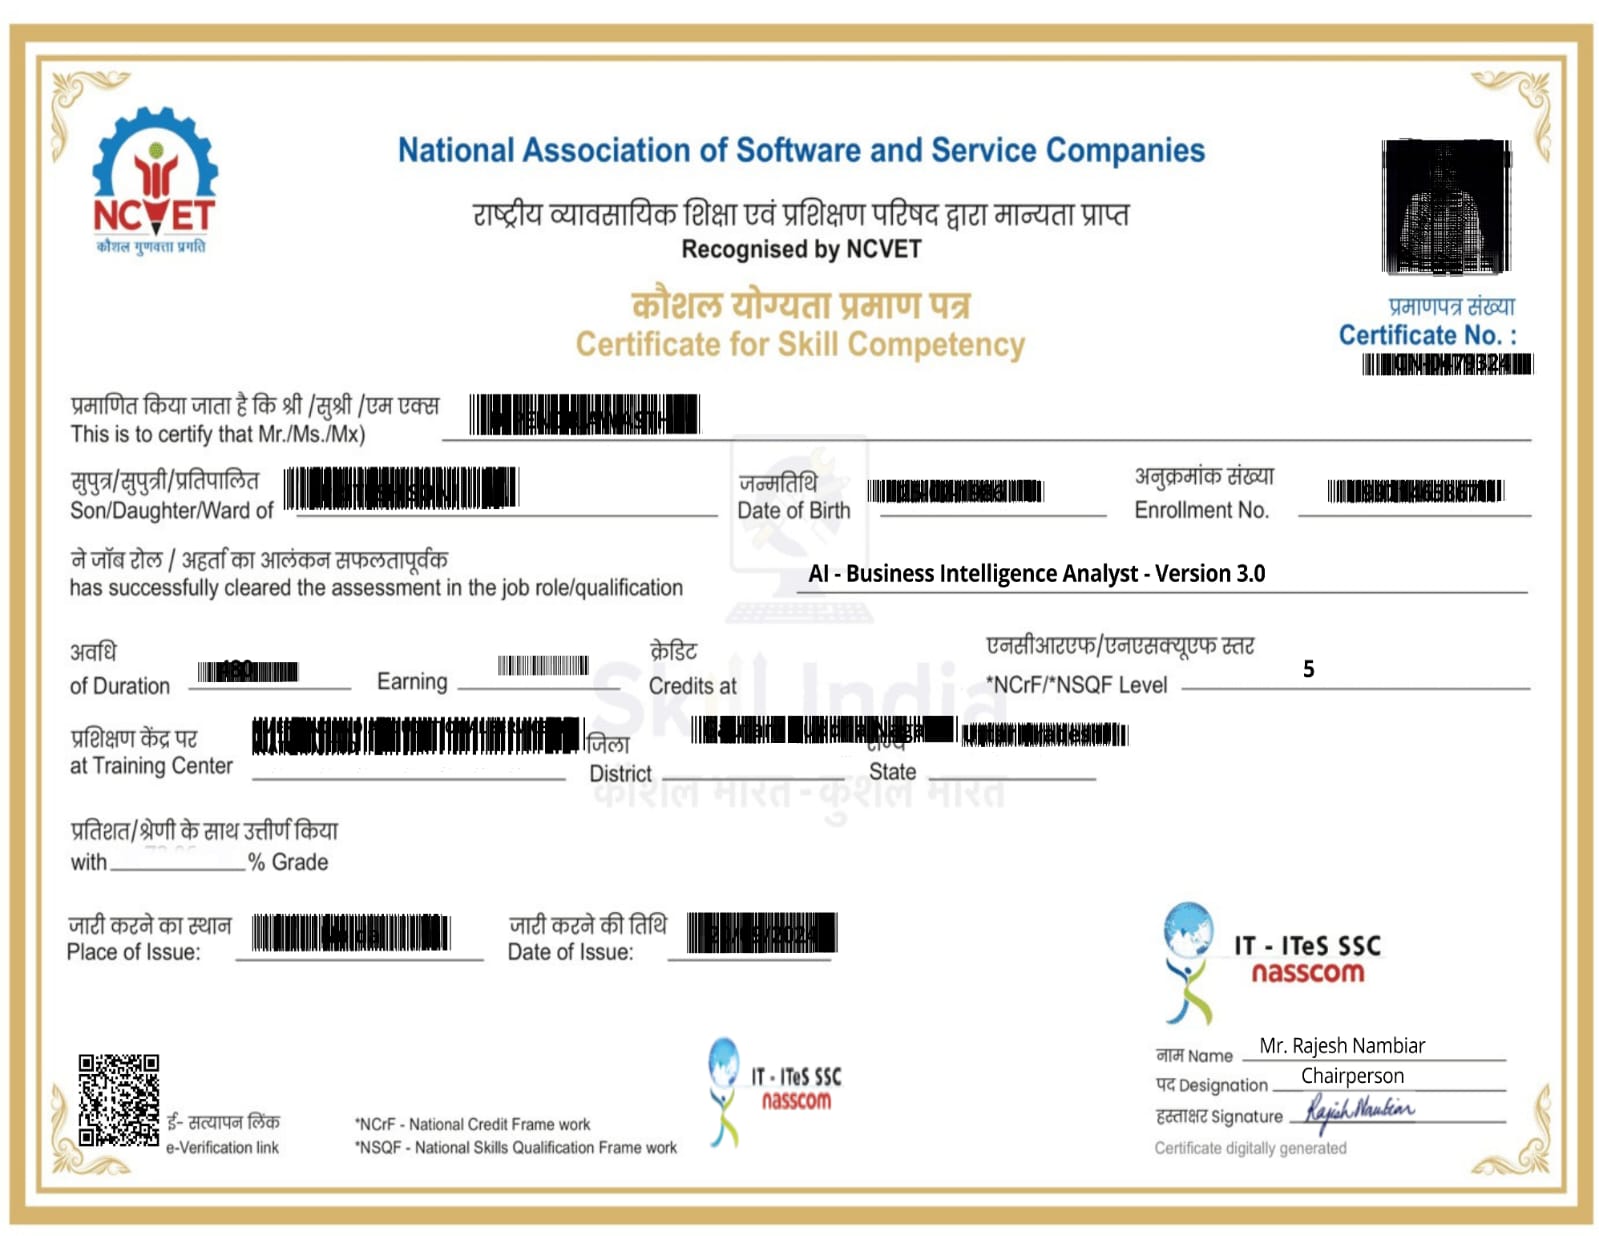
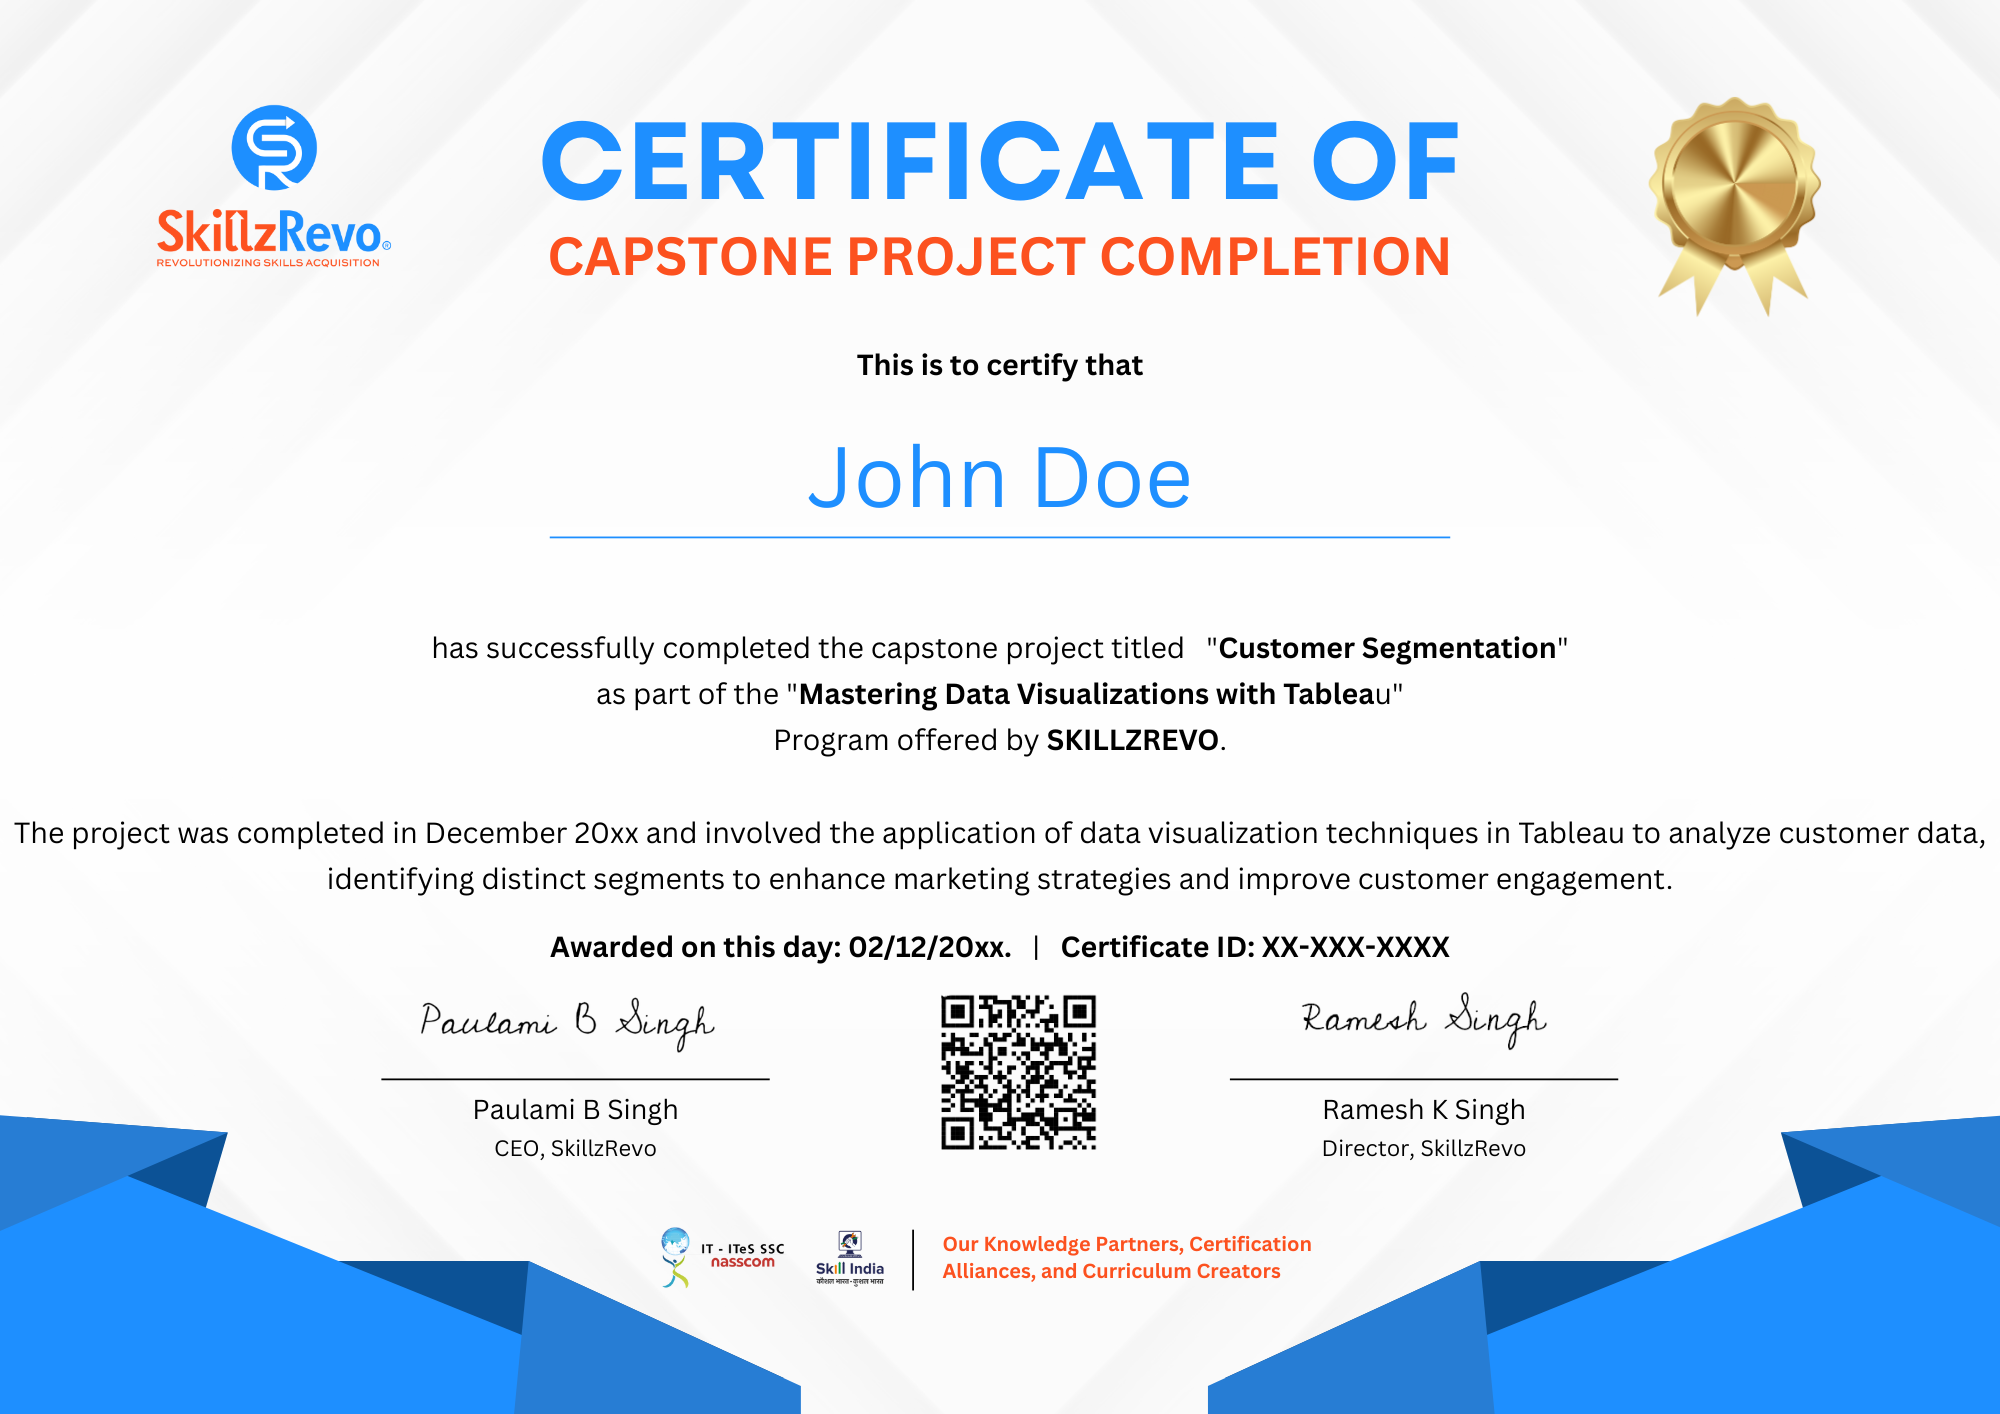
✅ Provides recognized certifications that validate your expertise, boosting your professional credibility and enhancing career prospects.
✅ Offers flexibility to tailor learning paths based on your career goals and interests, allowing for deeper exploration of specific tools or techniques.

Mastering in Data Visualization with PowerBI
Program Certifications

Mastering in Data Visualization with PowerBI Curriculum




Mastering in Data Visualization with PowerBI Skills Covered

Mastering in Data Visualization with PowerBI Tools Covered

Mastering in Data Visualization with PowerBI Program Benefits

Gain expertise in key tools and technologies that are highly sought after in the data and analytics industry.
Enhance your employability with certifications that demonstrate your proficiency in essential data management and visualization tools.
Learn from an up-to-date curriculum that reflects the latest industry standards, ensuring your skills remain relevant.
Tailor the program to fit your specific career objectives and interests, allowing for focused skill development.
Learn to transform data into clear, actionable insights that can be effectively communicated to stakeholders.
Admission Process
The application process consists of three simple steps. An offer of admission will be made to selected candidates based on the feedback from the interview panel. The selected candidates will be notified over email and phone, and they can block their seats through the payment of the admission fee.
